The need
In February I took over the social media of the company I work for. I changed approach, built an editorial plan and asked a creative to bring to life social templates that would give a younger, more appealing image. The results came, but I had to find a way to collect them, present them and help both my manager and the CEO understand them without losing too much time.
So I created a dashboard: an HTML file that is shared by email and lets you see at a glance what is going on.
How it works
I built it with Claude. At the start of each month I upload the previous month’s exports and screenshots, and the dashboard updates.
In very little time I can see the overall results, those of a single channel, and compare them with a set of competing companies identified beforehand. The overview clearly shows how much we have grown since February, with cumulative follower charts and the totals for the period.
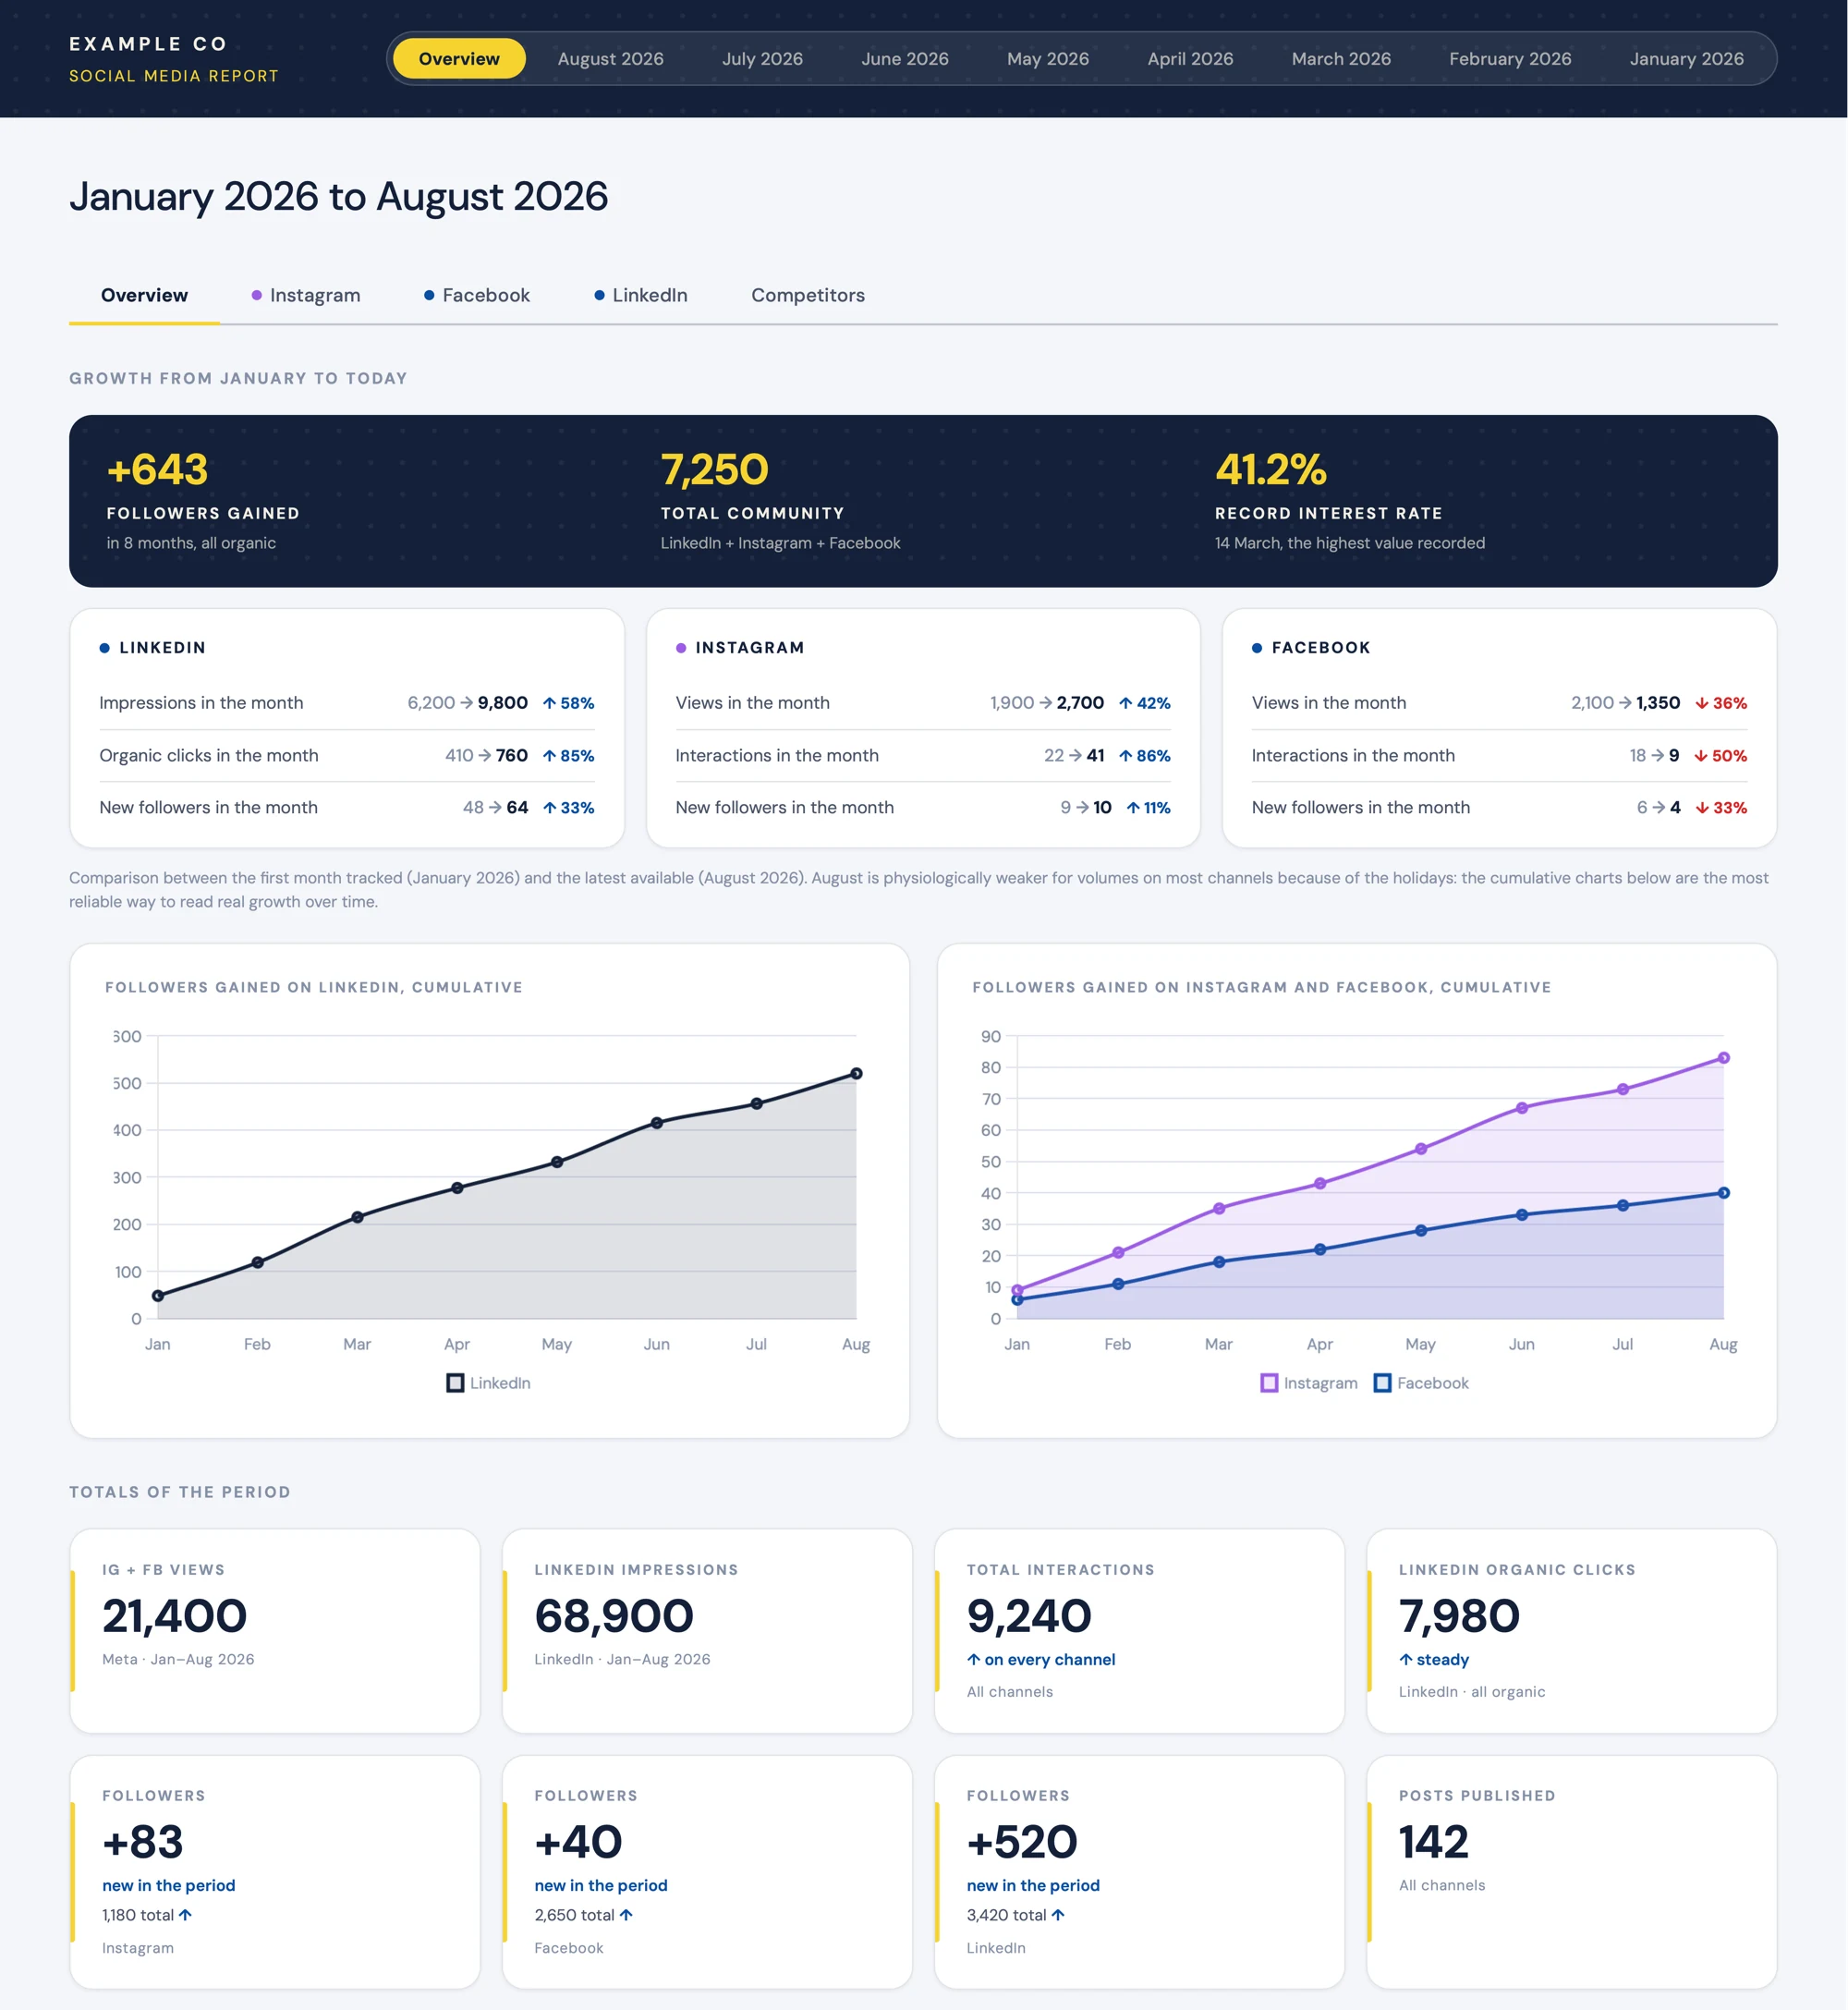
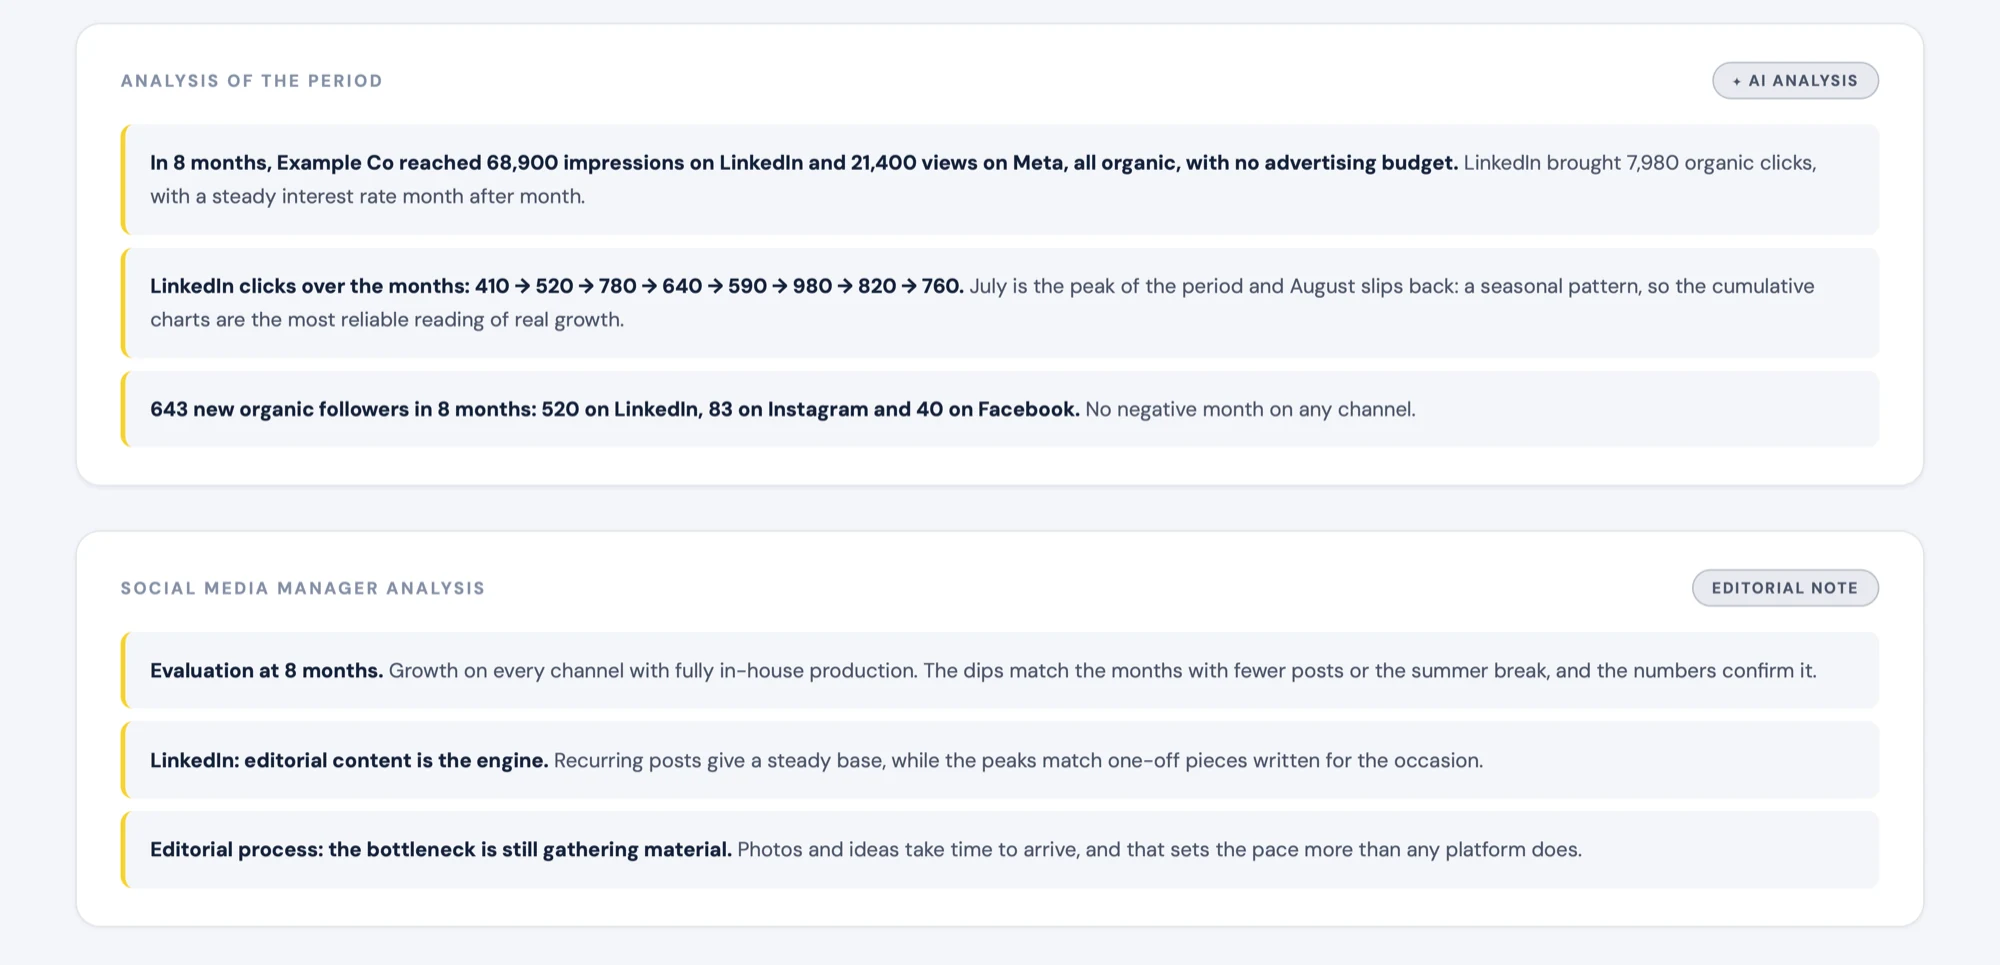
Every view comes with two readings of the numbers: one written by the AI, with more numerical analysis, and one written by me, with more qualitative information that also helps monitor the team’s participation, interpret dips and suggest new directions.
On top of that, the dashboard uses the same colours and the same font as the social templates, so the report looks like part of the same work.